

Demystifying App Performance: A Guide to Application Benchmarking in Android


Table of contents
- Understanding Performance Benchmarking
- Benefits of benchmarking your applications
- Performance Benchmarking in Android
- The Macrobenchmark Library
- Running your first performance benchmark test
- Prerequisites
- Project prerequisites
- The project
- Adding the Macrobenchmark module to your project
- Inspecting the code
- Firing our first metric test
- Analyzing Macrobenchmark test results.
- Benchmarking user journeys
- Adding a benchmark test for the rotation animation
- Analyzing animation benchmark results
Introducing Cathy, a skilled Software Engineer who has created a groundbreaking car parking app.

After dedicating countless hours to coding and fixing bugs, Cathy is thrilled to release her app to the world. She has high hopes for its success and eagerly awaits positive feedback and high download rates.
As time goes by, Cathy begins to observe that the performance of the app is not meeting her standards. Several users have expressed dissatisfaction with the sluggish start-up, poor animations, delayed scrolling, and frequent crashes. Additionally, there has been a significant number of users uninstalling the app.

Cathy is concerned about these problems and decides to investigate further to identify the root cause of these issues and improve the app's performance.
Cathy researched different tools and techniques to improve her app's performance. She found the Macrobenchmark library, which promised a comprehensive analysis of her app's performance. Intrigued, she decided to try it out. If you're experiencing similar issues, you've come to the right place! In this article, we'll follow Cathy's journey and guide you on how to benchmark your app's performance and gain valuable insights.
Understanding Performance Benchmarking
Performance benchmarking is the process of evaluating the performance and efficiency of an Android application, library, or system by running it through a series of tests and measuring its performance metrics. The main goal of performance benchmarking is to identify bottlenecks, inefficiencies, and areas of improvement to enhance overall user experience and optimize app performance.
The benchmarking process involves executing the app under controlled conditions and measuring various performance indicators such as:
Response time (launch times, button clicks)
CPU usage
Memory Usage (RAM consumed)
Battery consumption
Network performance
Frame Rate (animations, scrolling)
By measuring these metrics, developers can compare the application's performance against predefined benchmarks or industry standards. Furthermore, benchmark results can assist teams to make data-driven decisions for optimizing and fine-tuning.
In Android development, performance benchmarking is a crucial practice. It helps teams ensure that users have seamless and responsive experiences on various devices and usage conditions.
Benefits of benchmarking your applications
Consistency in user experience: benchmarking ensures your app performs well across different devices and Android versions. By testing the app under various conditions, developers can optimize for a broader user base.
Data-Driven Decision Making: with results from measured metrics, developers can prioritize development efforts, allocate resources effectively and make informed decisions about what optimizations to implement.
Early issue detection: running benchmarks can help detect issues early on during the development stage. Detecting these issues early on can prevent them from escalating, resulting in minimal performance-related problems once the application is released.
Performance optimization: Benchmarking is useful for identifying performance bottlenecks and areas that require improvement. By measuring the necessary metrics, we can identify specific areas that need optimization, resulting in a more efficient application.
Competitive advantage: having a high-performing application can give it a competitive advantage in the market. Users are more likely to prefer and recommend apps that provide smoother performance and minimal resource usage.
App performance and user experience walk hand in hand - if one stumble, the other feels the impact in every click and swipe.
Performance Benchmarking in Android
To analyze and test various scenarios in your app, Android provides two benchmarking libraries and methods: the Macrobenchmark and Microbenchmark libraries. The utilization of these two libraries is dependent on various methods for analyzing and testing different scenarios within your application.
Macrobenchmark: this library measures the interactions of end-users with larger aspects of the system, such as start-up, user interface interaction, and animations.
Microbenchmark: this library benchmarks application code by directly running it in a loop. It is specifically designed for measuring CPU performance under best-case scenarios, such as warmed-up Just in Time (JIT) and cached disk accesses, which are typically seen in inner loops and hot functions. This library only measures the code that you can call directly in isolation.
In this article, I will only focus on the Macrobenchmark library. For further comparisons between these two libraries, you can check out the documentation here
The Macrobenchmark Library
As mentioned above, the Microbenchmark library measures the interaction of end-users with larger aspects of the system. When discussing application development, the larger aspects that are considered are higher-level interactions and behaviors that involve multiple components and processes within the app. These aspects include UI interactions, screen transitions and navigation, startup time, battery consumption, data loading and processing, and memory usage.
This library's main advantage is that it allows you to have complete control over the testing environment. With this tool, you can manage the compilation process and start or stop your application to accurately measure its startup or scrolling performance. That is the key advantage it has over the Microbenchmark library.
The Macrobenchmark library is specifically created to work seamlessly with Android development. It is capable of benchmarking not only mobile applications but also custom-built Android libraries. The integration process is relatively straightforward, enabling developers to efficiently incorporate performance benchmarking into their projects.
Running your first performance benchmark test
Well phew! That's that with all the technical wording!
Now it's on to the fun part! Let's add the Macrobenchmark library to a project and use it to run a performance metric test.
Prerequisites
Before adding the Macrobenchmark library, you need to have the following:
Android Studio Dolphin (2021.3.1) or newer
Kotlin knowledge
Basic understanding of testing in Android
A physical Android device
A cup of coffee because why not?
Project prerequisites
- Ensure that your Android Gradle Plugin is 7.3.0 or higher and your Gradle plugin is 7.4.0 or higher. You can check the compatibility of the AGP and Gradle plugin of your project here
The project
We will be using a basic application that allows the user to rotate an image left or right using two buttons for our initial performance benchmark. The primary performance metric we will be evaluating is the smoothness of the rotation animation, which can be viewed in the provided gif:
As a bonus, we will also measure the speed at which the application launches, known as TTID (Time To Initial Display).
You can clone the project here Github link and switch to final-macrobenchmark branch to see the final benchmark test.
Alright, let's get to work!
Adding the Macrobenchmark module to your project
To use the Macrobenchmark library, you must create a separate module for it. This process is similar to creating a feature module in modularized projects :
In Android Studio, select File>New>New module. A create new module prompt will be shown:
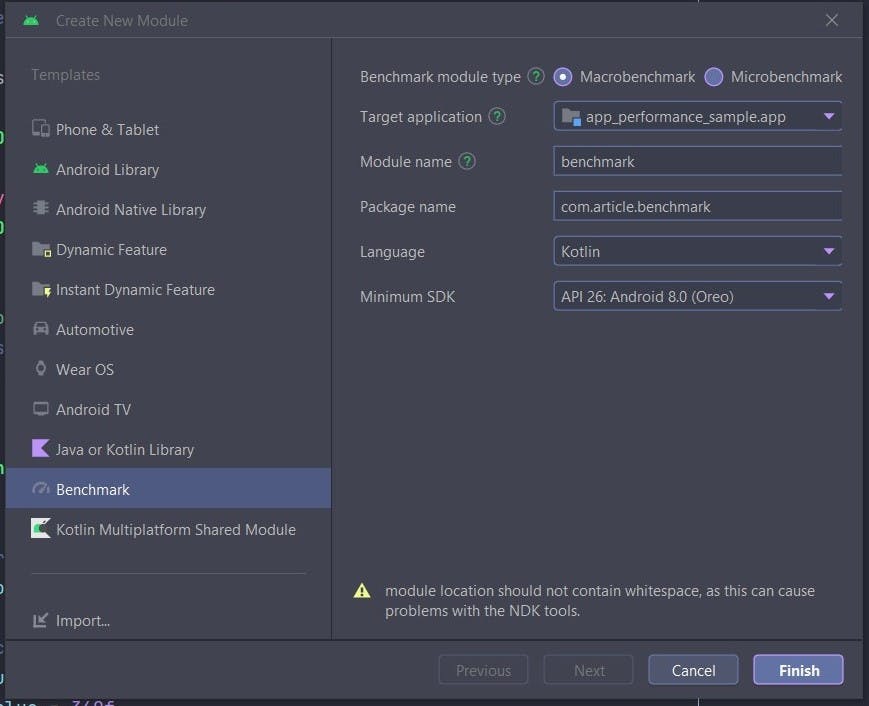
Please make sure to choose the Benchmark option and select Macrobenchmark instead of Microbenchmark. The other fields can remain unchanged. Click Finish and wait for the project to finish building.
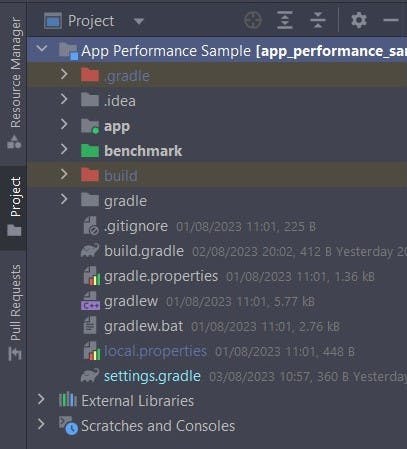
On your project panel, you will notice a green folder with the name benchmark.
Congratulations! Cue in the fun fair, we have created our very first benchmark module! So should we go ahead and run our performance metric test? Nope! We have a few steps to go, so calm down.
Go into your application's manifest and ensure the <profileable android:shell="true /> tag is added within your <application/> tag. Running performance benchmarks is resource intensive and will affect the application performance, adding the profilable tag will ensure the reading of detailed trace information without affecting performance. By default, the tag is added automatically after generating the benchmark module.
Inspecting the code
When you open the benchmark module folder under java/com/article/benchmark package you find the ExampleStartupBenchmark.kt file. This example is generated for you by Android Studio to give you an overview/structure of what's expected.
@RunWith(AndroidJUnit4::class)
class ExampleStartupBenchmark {
    @get:Rule
    val benchmarkRule = MacrobenchmarkRule()

    @Test
    fun startup() = benchmarkRule.measureRepeated(
        packageName = "com.article.appperformancesample",
        metrics = listOf(StartupTimingMetric()),
        iterations = 5,
        startupMode = StartupMode.COLD
    ) {
        pressHome()
        startActivityAndWait()
    }
}
As observed above, a benchmark is essentially an instrumented test that's run on your device. In the example provided, the performance metric being evaluated is the app start-up time or TTID. To understand what's occurring, let's analyze the code snippet above:
the
benchMarkRuleis the rule to be used to provide the testing behavior for the Macrobenchmark.the
startUp()function as the name suggests, tells the test to run on app startup and thebenchmarkRule.measureRepeated()sets the metrics which we want to measure during the app's performance.To get these metrics specific to our app it needs the
packageNameof the app.metricsdefine what we want to measure in this case, app startup timeStartupTimingMetric()iterationsare the number of times we want this benchmark test to run. The milliseconds between each metric test vary, so, for efficiency, it is iterated a couple of times to remove bias. Iterations should be greater than 0 or the IDE will highlight the field as an error.startupModecan either be StartupMode.COLD, StartupMode.WARM, StartupMode.HOT, they all vary according to requirements. COLD means the app is not launched at all and takes a long time. WARM faster and activity is already in the background. HOT the activity is already loaded and in memory.
Firing our first metric test
Before running the first metric test we need to run through a couple of things on our checklist:
Macrobenchmark tests should be run on physical devices and not emulated ones. Physical devices are closer to real-world parameters. To set up your physical device to run your mobile applications look at this tutorial here: Set up your android device
Ensure obfuscation is disabled for your application when trying to run a benchmark. For you not to interfere with already in-place obfuscation settings for your production app, create separate
benchmark-rules.proproguard file in your main app module and add -dontobfuscaterule. Head back to the benchmark module and within itsbuild.gradlefile add thebenchmark-rules.profile to thebuildTypesbenchmark block:android { /...../ buildTypes { benchmark { debuggable = true signingConfig = debug.signingConfig matchingFallbacks = ["release"] proguardFiles("benchmark-rules.pro") } } /....../ }Run benchmark tests on your release build and not on your debug build. The release build is more tailored to what the user will have. Running benchmark tests on debug builds can cause deviations from the results of the release build. For the sake of this tutorial, since we are learning, we will use the debug build.
Do not run benchmark tests when the device is on low battery.
In your app module
build.gradlefile, add the following dependency:implementation "androidx.profileinstaller:profileinstaller:1.3.1"For some reason, benchmark tests require this dependency to run otherwise all manner of build errors occur.
Now we run the benchmark test:
Change the build variant first before running:
Go to build>Select build variant. On the Active Build Variant column change it from debug to benchmark :

Ensure your physical device is connected, preferably through USB debugging.
Open the ExampleStartupBenchmark.kt file and run the startup() test.
Analyzing Macrobenchmark test results.
Don't worry if you see the application launching and terminating multiple times after running the test. This is expected because we previously set the iterations number to 5 in benchmarkRule.measuredRepeated(), and the test is simply responding to that.
If the test runs successfully with no error, you will see several logs. The only part we are interested in looks like this:
ExampleStartupBenchmark_startup

timeToInitialDisplayMs min 158.2, median 166.5, max 195.8

Traces: Iteration 0 1 2 3 4
I know you are probably thinking, what I'm I looking at here?
Do not worry young padawan, once again, I got you!
Let us break down this benchmark test result:
StartupTimingMetric has captured one value timeToInitialDisplay . This measures the time taken from when the app first receives the launch intent to when the first frame of the destination activity is rendered.
The min<value> median<value> and max<value> represents the time taken for your application to come into full view hence the time to initial display (TTID). The median value is crucial as it indicates the average time taken for all iterations. For our app, the median time it took to complete a TTID was 166.5 milliseconds, indicating a satisfactory speed. If you're looking to speed up launch times, it's best to keep the median value as low as possible.
Benchmarking user journeys
User journeys are simply the activities the user will do within your app. So scrolling through lists, clicking buttons etc.
For example, we can test the performance of frame rates in our rotating animation once the user clicks the rotate left or rotate right buttons.
Unlike most Android UI tests, Macrobenchmark tests run in a separate process from the app itself. This is done so to enable necessary things like killing the app process and compiling the app via shell commands. For this reason, we cannot use APIs like ActivityScenerio which may require the test APK to classload from the instrumentation target.
To solve this issue, you can utilize the UI Automator library that is already included in the Macrobenchmark module. You can also use any other means of out-of-process automation to run these tests.
Adding a benchmark test for the rotation animation
For this, we are going to add an extension function so that this test can be reusable:
fun MacrobenchmarkScope.testRotationAnimation() {
    val rotateLeftBtn = device.findObject(By.text("rotate left"))
    val rotateRightBtn = device.findObject(By.text("rotate right"))

    device.waitForIdle()

    rotateRightBtn.click()

    device.waitForIdle(1000)

    rotateLeftBtn.click()

    device.waitForIdle(1000)
}
Here the code is simple:
To trigger the rotation animation on the image, we use the UI Automator library to locate the two buttons responsible for rotating it right or left. By using the
By.text()function, we can locate these buttons based on their text labels.We then tell the test to wait until the device is idle.
After everything is visible, click on the
rotateRightBtn. Then, wait for one second and click on therotateLeftBtn. Finally, wait for another second.
To implement the testRotateAnimation() function in the ExampleStartupBenchmark.kt file, we need to first call another function. Please add the function provided below to your code:
  @Test
    fun rotateAnimation() = benchmarkRule.measureRepeated(
        packageName = "com.article.appperformancesample" ,
        metrics = listOf(FrameTimingMetric()) ,
        iterations = 5 ,
        startupMode = StartupMode.COLD
    ){
        pressHome()
        startActivityAndWait()
        testRotationAnimation()

    }
Just like the startup() test previously, this rotation test will be repeated 5 times. However, the difference lies in the metrics we are testing. This time, we are using the FrameTimingMetric(). This metric captures timing information from frames produced by a benchmark, such as scrolling animations or regular animations.
Analyzing animation benchmark results
From the Macrobenchmark guide*, "As the test specifies a FrameTimingMetric, the timing of frames will be recorded and reported as a high-level summary of frame timing distribution - 50th, 90th, 95th, and 99th percentile."*
The outcome for our situation is as follows:
ExampleStartupBenchmark_rotateAnimation
frameDurationCpuMs   P50    8.0,   P90   17.2,   P95   20.4,   P99   30.8
frameOverrunMs   P50   -0.3,   P90    9.5,   P95   16.8,   P99  197.4
Traces: Iteration 0 1 2 3 4
FrameTimingMetric() measures two metrics, frameDurationCpuMs and frameOverrunMs .
For frameDurationsCpuMs , the 50th percentile for frame timing is 8.0 ms, while the 90th percentile is 17.2 ms. These results indicate how long it took the CPU to process and render the frame. The higher the percentile, the longer it took for the frame to render. The 50th percentile is the median time it took for the frame to render. The 90th, 95th, and 99th percentiles are the times it took for the frame to render for 90%, 95%, and 99% of cases, respectively. The lower the time in milliseconds the faster the frame took to render.
For frameOverrunMs, the 50th percentile is -0.3 ms, with the 90th percentile being 9.5 ms, the 95th being 16.8 ms, and the 99th percentile being 197.4 ms. The duration of frame overrun indicates the amount of time between when the frame should have been rendered and when it was rendered. The higher the percentile, the longer the duration of frame overrun. Negative values do not necessarily mean there is a problem. In fact, it could indicate that the frame was rendered at a faster rate, which is considered a positive outcome. The ower the duration value the faster the frame was rendered.
You can also use the Android Studio Profiler tool to read benchmark test metrics, look at example here .
Conclusion
For a quick recap, here is what we have learned in this article :
We looked at what performance benchmarking is and why it is necessary to perform them in our mobile applications.
We've also looked at the benefits of benchmarking our applications.
Performance benchmarking in Android applications and the types of benchmarking tools we can use. (Macrobenchmark and Microbenchmark libraries).
How to add the Macrobenchmark module to our applications and run performance metric tests.
How to benchmark TTID (Time to initial display) and animations.
How to read and analyse performance metric results.
Thank you for sticking around till this end!
Resources used:
Benchmarking your app: Official Android Documentation: link to doc
Jetpack Macrobenchmark guide : link to doc
This is how you measure the performance of your app: Phillip Lackner Youtube: video link
Access the project repository here: Project repository.
If this article has helped you in some way, please feel free to give it a like and share! Also, you can buy me a coffee here to support what I do: buy me coffee here